Statgraphics is one of the oldest and yet most innovative statistical analysis programs for the PC. Developed by a Dr. Neil Polhemus, Professor of Statistics at Princeton University, in 1980 to bring the power of statistical analysis to the business world in order to unleash maximum profitability while also delivering high-quality products. Statgraphics has maintained it's an investment in its products from day one providing the leading edge solution for corporations worldwide. In the latest release of Statgraphics has been added for "big data" ( millions of rows of data ) while simultaneously adding 30 new statistical analysis procedures. Statgraphics has built a reputation for delivering high-quality products that are easy to learn, easy to use and bridge the gap between researchers and analytics professionals.
Features:
s Big Data with millions or rows of information
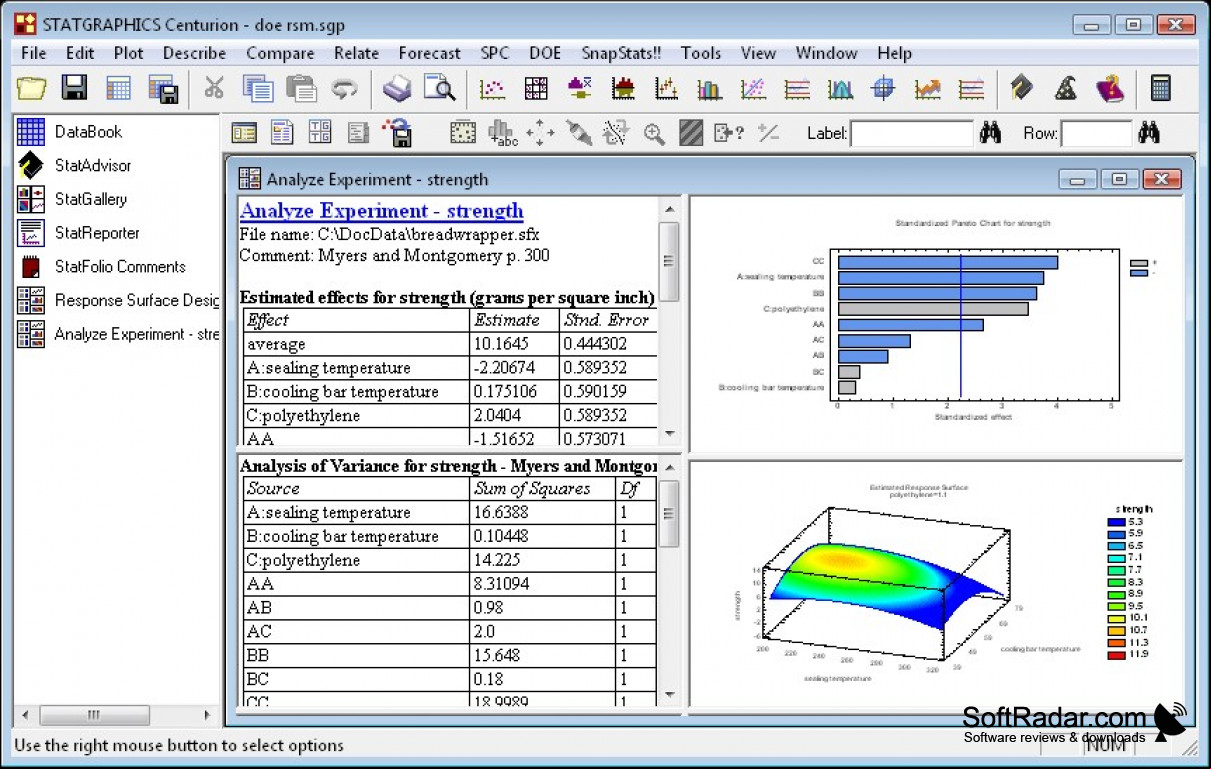
Data Visualisations that allow s to easily view data trends
Point by point assistance tools make Statgraphics easy to learn and easy to use
260 data analysis procedures allow you to easily meet your specific data analysis objectives
The R Interface allows programmers to customize Statgraphics to meet any objective
Stat Advisor to help you colleagues easily understand statistical analysis
Statgraphics is the leading statistical analysis package available on the PC. With a focus on making statistical analysis available to any business independent of whether or not they hire professional statisticians, Statgraphics has unleashed the power of data analysis to help corporations large and small. With all of the data visualization built into Statgraphics the work is removed from preparing reports to be consumed by both management teams and the end-customers of our s. Unleash the power of statistical analysis to help improve your products quality, improve your internal processes and understand both short term and long term trends to help s maximize your profitability while always delivering high quality to your customers.
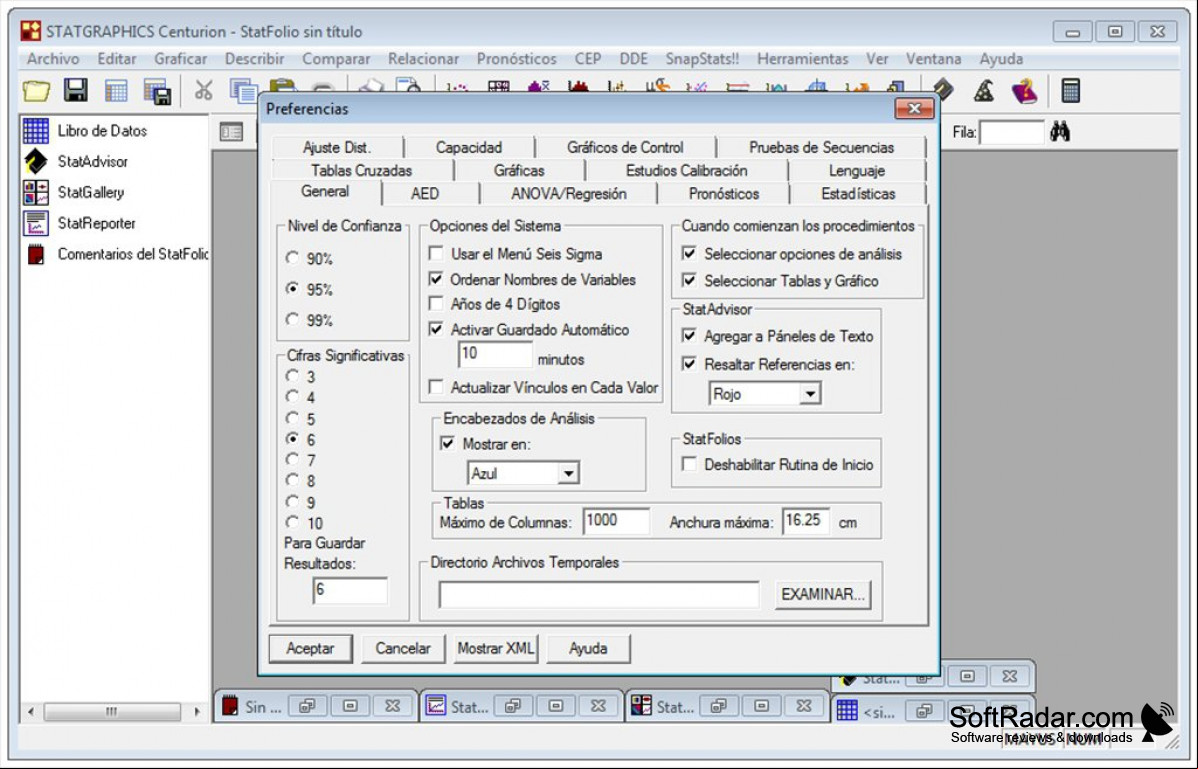
Statgraphics is easy to use and easy to learn due to it's built in assistants
ADDITIONAL SCREENSHOTS
ADDITIONAL INFO
Operating system: Windows 7 or later
At least 2 GB of RAM
Hard drive with minimum 1 GB available space
Internet connection for updates and features
PROS
Powerful statistical analysis and data visualization tools. Friendly interface for easy navigation. Provides reliable results for decision making.
CONS
Limited features compared to some industry-standard statistics software. Steep learning curve for less tech-savvy s. Expensive for personal s or small businesses.
👨💻️ REVIEWS AND COMMENTS 💬
Ronald Pruitt
Stat graphics is an old but trustworthy brand in statistical software applications. The application itself is in a constant development cycle and features are constantly added, such as the recently added 30 new statistical analysis procedures. The app developers strive to make the app as easy to use as possible and also easy to learn so that it can be used in the business setting to harness the power of statistical analysis. The app also allows many customization features such as implemented R language that allows full customization of your statistical analysis procedure.
James
Older software that still works great and can be used in any home. It works really well when using large amounts of data and comparing the data against each other. The older software look may appeal to quite a few people. I love the retro feel and look.
Leon
If you need to run statistical analyses but aren't a professional statistician, you should check out Statgraphics for Windows. This tool offers all the horsepower needed to perform statistical calculus and anlysis. However, it's simple enough that someone without a statistics background can use it. It s a lot of file formats ranging from XML to SF3. It lets you categorize and organize your results prior to publication, and helps illustrate your data through graphics.
Mason
Statgraphics is a software program used in data analysis and visualization. Statgraphics for Windows is software used for the integration of graphics into statistical procedures. It also offers data modeling and predictive analytics making it to be sought after by both academia and corporate. It is able to provide summary statistics and advanced statistical models. For individuals and organizations with huge data needing analysis and visualization i recommend Statgraphics software.
Ethan
Statgraphic is great software for windows that provides the with tools for regression analysis, multivariate statistics, Design of Experiments, statistical process control, life data analysis and data visualization. It offers a great and simple interface for understanding
Lucas
Statgraphics provides the interface much easier to use. The Data Visualizing helps to get a bigger picture.With the help of R interface, the gets to expand the capabilities. The stat advisor makes statistical output understandable. The interactivity and quality management give good towards the s to make feel of good experience to work with the software product.
Cameron Fragnito
Statgraphics is a powerful and comprehensive statistical software package that allows s to analyze data, create graphs, and explore complex relationships between variables. It provides an array of features and functions to data analysis, including predictive modeling, Monte Carlo simulation, and statistical process control. Statgraphics also includes powerful visualization tools to help s easily interpret and communicate their results.
Hamish X********t
I recently used Statgraphics software for a project in my college course. I found it to be quite intuitive and -friendly. The software was able to quickly and accurately generate graphs and charts. It also had a number of built-in statistical tests and functions that I found to be extremely helpful. The software was also able to quickly generate reports with all the relevant information. I found the software to be quite reliable and efficient, and I had no problems while using it. Furthermore, the customer service was very helpful when I had any questions. All in all, I was very satisfied with the performance of the software.
Andrew V*******a
Statgraphics software is a great tool for data analysis. It is easy to use and navigate, providing a great experience. The software is well-suited for both experienced and novice s, offering a good range of features and capabilities. I have found the software to be reliable and helpful in the tasks I've used it for. The graphical output is clear and easy to interpret.
Kayden P*****x
Statgraphics software provides a wide range of statistical analysis tools and features, making it a comprehensive option for data analysis. However, the interface can be overwhelming for beginners.
Harrison M.
Statgraphics software is a comprehensive statistical analysis tool with a -friendly interface and a wide range of functions.
Calum
Statgraphics, revered as a versatile statistics tool, provides an analytical arsenal for data visualization, statistical modeling, and quality improvement methodologies. Its main feature is a comprehensive set of capabilities for exploratory data analysis, allowing s to manipulate, compare, and analyze massive datasets effectively. This software also s a wide range of statistical procedures and provides accurate results in real-time, gaining a reputation for its -friendly interface and dependable output.
Charlie
Easy to use with a wide variety of statistical analyses available.