Gnuplot 5.2.5
by Gnuplot
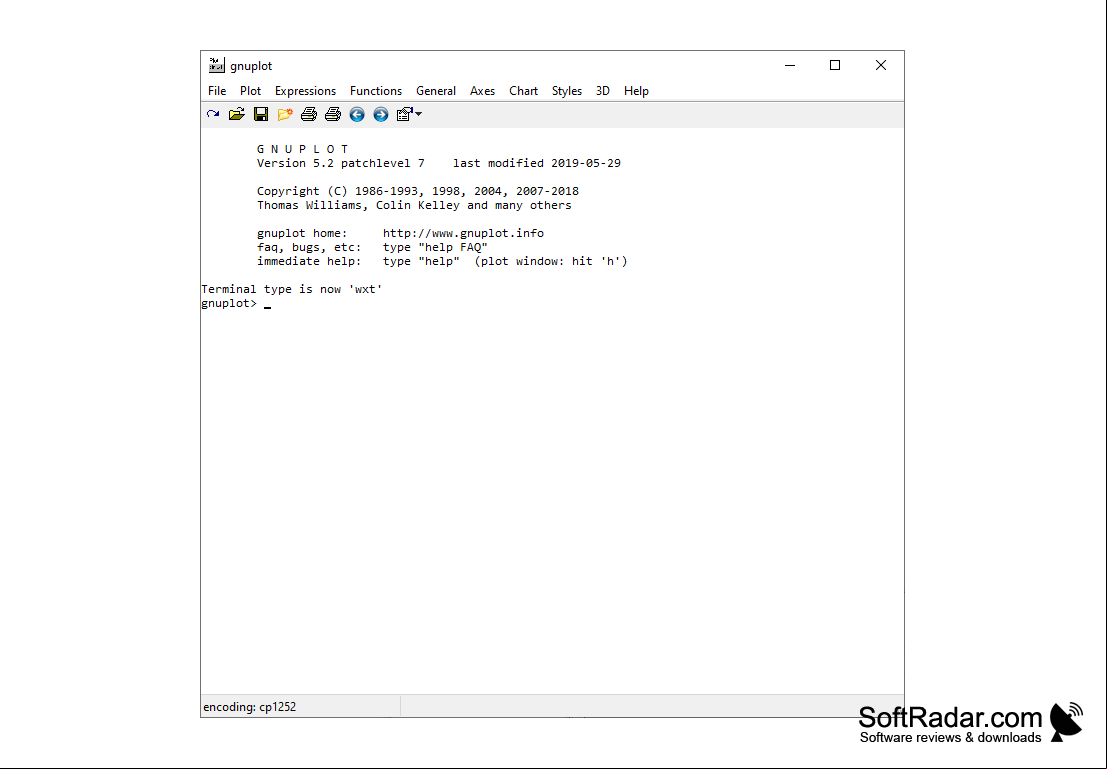
A command-line program which greatly expands the extent of functions you are able to use
Gnuplot software (version 5.2.5) is a command-line driven program for creating scientific graphs and plots. It s various types of plots including 2D and 3D plots, contour plots, and heatmaps. The software also has extensive customization options for labels, titles, and colors, and s various output formats such as PNG, PDF, and SVG. Additionally, Gnuplot can be used in conjunction with other programming languages such as Python and C++.